
.png)
Get monthly updates on FP&A best-practices and more.
January’s goals always look great on a whiteboard. Then reality arrives.
By mid-March, you have something that projections can’t provide: actual results.Revenue that materialized or didn’t. Expenses that crept higher than planned or stayedin line. Cash that flowed on schedule or stalled between an outstanding invoice and a vendor payment.
Most business owners acknowledge Q1 data exists and quietly move on. But think about what you actually have right now. Ninety days of truth. Not projections. Not hopes. Real numbers that tell you whether the plan you built in January is holding up or quietly falling apart.
Here’s how to use them.
Run the Actuals vs. Plan Comparison (For Real This Time)
You set goals for the year. Have you revisited them with hard numbers in hand? The Q1actuals-to-plan comparison is where financial planning stops being theoretical and startsbeing useful.The question isn’t just “Did we hit our numbers?” It’s “Why or why not, and what doesthat tell us about the next nine months?”
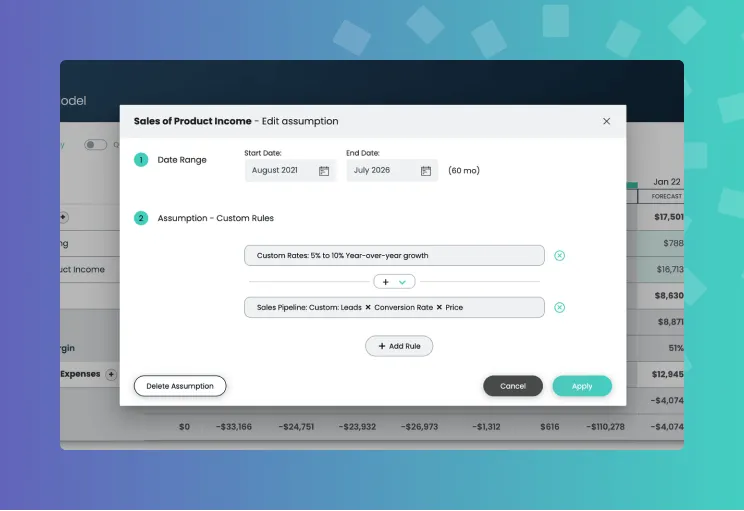
Start with the revenue reality check. If you’re above plan, is it sustainable growth or a one-time spike? If you’re below, is it a timing issue or a structural problem like pricing pressure or churn? The answer changes your entire approach to the rest of the year.Then look at expense drift. This one is sneaky. Payroll adjustments, contractor fees, and vendor price increases can collectively push operating expenses 5 to 15 percent above plan without a single dramatic line item standing out. Most people only look for the outliers. The real story is usually in the aggregate.Finally, examine margin movement. Revenue growth means nothing if margins are compressing. Compare your gross and operating margins to the same period last year.A shrinking margin tells you costs are outpacing growth. That’s the kind of trend that becomes an emergency by Q4 if you don’t catch it now.With Clockwork, this comparison happens automatically. Your financials are connected to QuickBooks or Xero in real time, so the actuals-to-plan view is always current. Nospreadsheets. No manual rebuilds. You just look.Stress-Test Your Cash Flow for Q2Do you actually know what your cash position looks like six weeks from now? Notroughly. Not “we should be fine.” Week by week, what’s coming in and what’s going out?Cash flow problems rarely announce themselves. A customer stretches payment terms.A new hire’s fully loaded cost hits harder than expected. A tax bill lands right when receivables are thin. None of these are catastrophic alone. Together, they create a gap that catches people off guard.March is the ideal moment to pressure-test your next 13 weeks. Three questions toanswer honestly:When will your outstanding invoices actually convert to cash? Optimistic assumptions about collections are one of the most common causes of cash crunches in growing businesses. Q1 gave you fresh data on how your customers actually pay. Use it.
What large expenses are locked in for Q2? Estimated quarterly tax payments are dueApril 15. Annual renewals, insurance premiums, and payroll are largely fixed. Map them week by week.
Where is the potential shortfall? If there’s a week in Q2 where projected cash dips below your operating minimum, you want to know now. Not when the direct debit fails.
Clockwork’s cash flow forecasting analyzes your actual transaction history and customer payment behavior, not just broad assumptions. The result is a 52-week, week-by-week forecast that reflects how cash genuinely moves through your business.Build Scenarios, Not PredictionsSingle-point forecasts are comforting. They’re also almost always wrong.Your January plan assumed a specific version of 2026. But shifting trade policies, evolving interest rates, and persistent cost inflation make it risky to bet everything onone version of the future. The smarter move is to plan for range, not precision.
Your Q1 actuals give you the baseline. Now build at least three scenarios:
Scenario A: Momentum holds. Q1 trends continue. Revenue grows at the current rate, costs stay in line, cash flow stays stable. This is your base case. Plan around it, but don’t bet on it.
Scenario B: Revenue softens. What happens if your pipeline slows by 15 to 20percent? If your biggest customer churns? Model the impact on cash, headcount, and profitability. Most business owners never run this scenario until they’re already living it.
Scenario C: Growth accelerates. This one doesn’t get enough attention. Rapid growth demands more working capital, more hires, more infrastructure, and the cashrequirements often outpace the revenue increase. If you land that big deal next month, are you actually ready to deliver?Clockwork’s scenario planning lets you build and compare these side by side. Adjust one assumption and see how it ripples through your entire financial model in real time.
Ask Your Data Better Questions
Here’s something that’s changed in the last year that not enough business owners aretaking advantage of. The biggest shift in financial planning isn’t a new spreadsheettechnique. It’s the ability to ask your financial data a question and get a real answerback.Why did gross margin drop in February? Which expense categories are growing fasterthan revenue? Where is money actually going? These used to require hours of diggingthrough reports, or waiting on a call with your CPA, or building a custom spreadsheetyou’ll forget to update next month.Mira, Clockwork’s AI FP&A analyst, lets you ask these questions in plain language andget an analysis grounded in your actual numbers. Not a generic template. Not aChatGPT-style guess. A real insight, specific to your business and your data.
Set Your Q2 Priorities (and Kill Something)
The temptation at the end of Q1 is to add. Another initiative, another hire, another tool.But the businesses that compound growth most consistently do the opposite. They use the Q1 review to cut what isn’t working and double down on what is.Which revenue streams, marketing channels, or customer segments outperformed?Give them more in Q2, not the same allocation. What’s quietly consuming resources without delivering? Q1 data gives you the evidence to kill it, pause it, or restructure it.And pay attention to what you didn’t anticipate. The most valuable Q1 insights are often the surprises. A customer segment that emerged unexpectedly. A cost that ballooned. Aproduct line that quietly became your most profitable. Surprises are signals. The question is whether you’re paying attention to them.
Conclusion
Conclusion: The 90-Day Advantage
Most businesses plan once a year and wonder why they’re always playing catch-up.The ones that outperform treat every quarter-end as a recalibration point, a chance to update assumptions, redirect resources, and tighten the gap between the plan on the whiteboard and the reality in the bank account.Your Q1 numbers aren’t just a report card. They’re a strategic asset. And right now, they’re as fresh and actionable as they’ll ever be.The window between Q1 closing and Q2 gaining momentum is narrow. Use it.Clockwork connects to your QuickBooks or Xero account and builds your financial model, cash flow forecast, and scenario plans in minutes, not days. Your Q1 review starts here.


.png)
.png)
.png)
.avif)


.avif)


.avif)

.webp)


.avif)


.png)
.avif)


.avif)


.avif)


